Trading performance metrics:
In the world of finance and investment, where myriad metrics and measures vie for attention, the Sharpe Ratio stands out as a beacon for assessing risk-adjusted returns. Whether you're a seasoned portfolio manager or a novice investor, understanding the Sharpe Ratio can provide invaluable insights into your investment strategy's efficacy. This comprehensive guide will unravel the intricacies of the Sharpe Ratio, from its calculation to its interpretation.
Introduction to the Sharpe Ratio
The Sharpe Ratio, named after Nobel Laureate William F. Sharpe, is a measure used to understand the return of an investment compared to its risk. In essence, it quantifies how much excess return you are receiving for the extra volatility of holding a riskier asset.
The Mathematical Essence: How is it Calculated?
The Sharpe Ratio is calculated using the following formula:
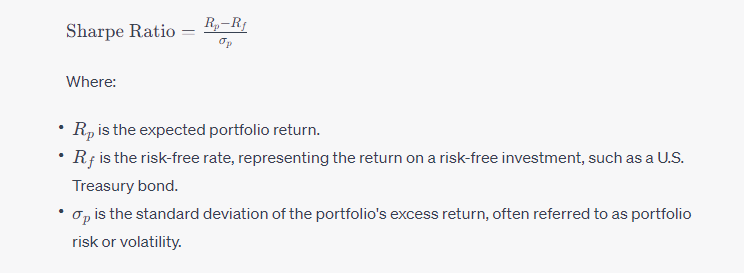
Interpreting the Sharpe Ratio: Good vs. Bad Values
Positive Sharpe Ratio: A positive value indicates that the investment returns more than the risk-free rate for the assumed risk level. The higher the Sharpe Ratio, the better the risk-adjusted performance.
Negative Sharpe Ratio: A negative value suggests that the investment is riskier than the potential returns justify. In other words, the investment is expected to perform worse than a risk-free asset.
Zero Sharpe Ratio: This indicates that the expected return on the investment is the same as the risk-free rate.
A Rule of Thumb:
- Greater than 1.0: Generally considered acceptable to good by investors.
- Greater than 2.0: Very good.
- Greater than 3.0: Excellent.
However, it’s essential to note that these are general guidelines, and the interpretation can vary based on the investment context and market conditions.
Sharpe Ratio in Action: Practical Implications
Portfolio Optimization: The Sharpe Ratio can guide investors in constructing portfolios that offer the maximum return for a given level of risk.
Benchmarking: By comparing the Sharpe Ratios of different portfolios or funds, investors can gauge their relative risk-adjusted performance.
Risk Management: The metric helps investors understand the risk they’re taking on and whether the potential returns justify that risk.
Limitations of the Sharpe Ratio
While the Sharpe Ratio is a powerful tool, it’s not without its limitations:
Assumption of Normal Distribution: The Sharpe Ratio assumes that investment returns are normally distributed, which might not always be the case. This can lead to an underestimation of risk in portfolios with fat-tailed distributions.
Risk-Free Rate Variability: The choice of the risk-free rate can influence the Sharpe Ratio. Different investors might use varying risk-free rates based on their investment horizons or market conditions.
Doesn’t Differentiate Upside vs. Downside Volatility: The Sharpe Ratio doesn’t distinguish between upward and downward volatility. This means investments with significant upward swings could be penalized.
Sharpe Ratio vs. Other Metrics
While the Sharpe Ratio focuses on risk-adjusted returns, other metrics offer different perspectives on investment risk:
Sortino Ratio: Similar to the Sharpe Ratio, but it only considers downside volatility, providing a more nuanced view of harmful investment volatility.
Treynor Ratio: This metric also evaluates risk-adjusted returns but uses beta (a measure of market risk) instead of standard deviation.
Alpha: Represents the excess return of an investment relative to the return of a benchmark index.
Conclusion
The Sharpe Ratio, with its focus on risk-adjusted returns, offers investors a lens through which they can evaluate the efficacy of their investment strategies. By quantifying the return per unit of risk, it provides a standardized measure to compare diverse investments or gauge a portfolio’s performance against benchmarks. While it’s an invaluable tool, it’s essential to use the Sharpe Ratio in conjunction with other metrics and qualitative insights. In the dynamic world of finance, where risk and return are two sides of the same coin, the Sharpe Ratio serves as a compass, guiding investors towards more informed and strategic decisions.
